Develop Your Career as a Certified Data Visualization Expert
With our Power BI course in Qatar, you can master Microsoft Power BI data visualization tools and gain insightful decision-making skills.
Microsoft Power BI Certification Training Course in Qatar
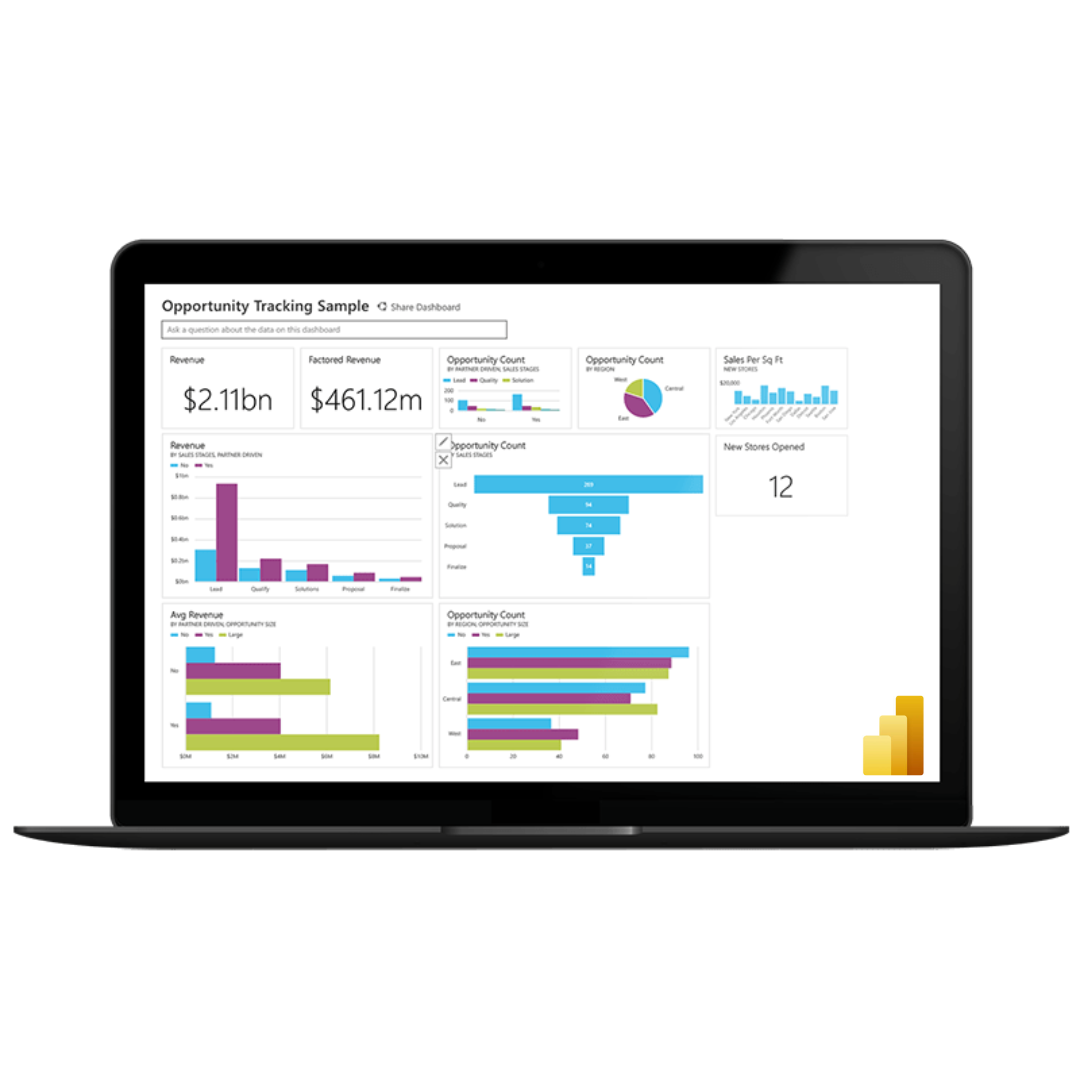
Join our Microsoft Power BI training certification course in Qatar offered by Infocus. In the course, you will learn to create stunning visualizations, upload reports and build dashboards to extract important insights. Anyone who wants to learn more about utilizing Power BI is intended audience for this course. You don’t need any prior experience, as this course will help you explore the basics of using Power BI for data analysis, visualization, and more.
Our Microsoft Power BI Training Course is Accredited by Ministry of Education


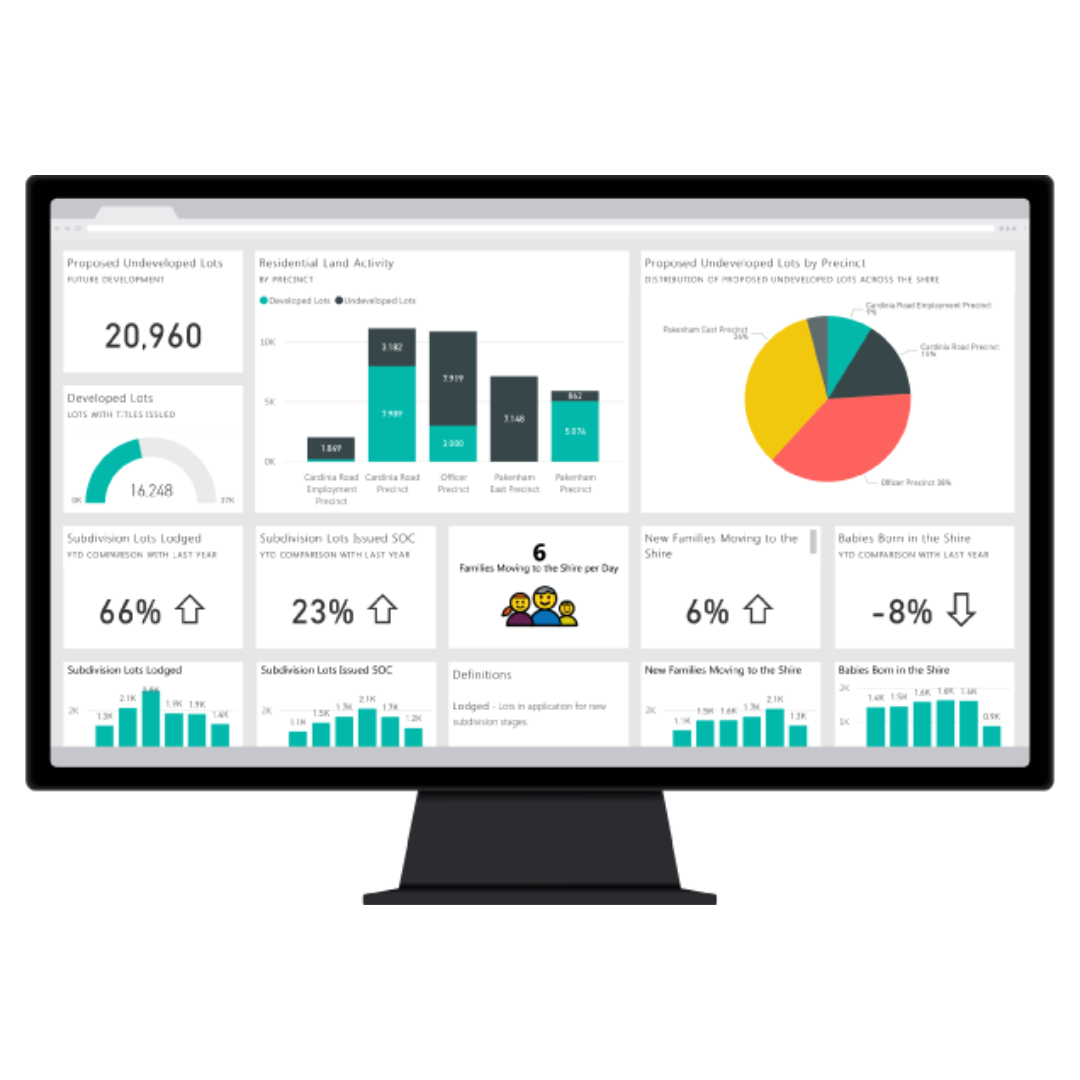
Certificate in Microsoft Power BI - Overview
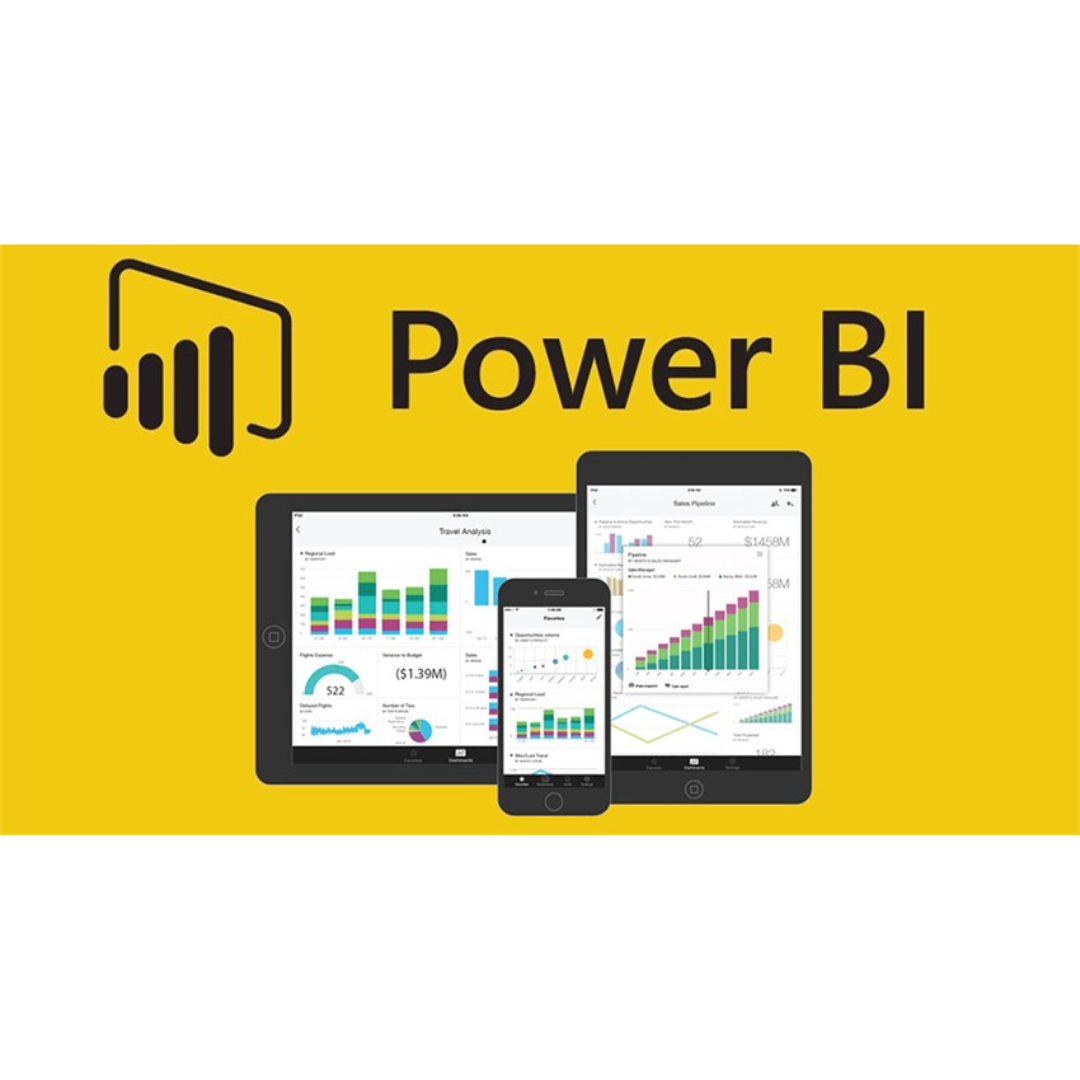
Power BI is a cloud-based business analytics service that helps you stay up-to-date with the information that matters to you. It helps create actionable dashboards from on-premises and cloud data in one central location that you can access across multiple devices. Data visualization is important to help you identify trends and patterns in your data set. It can help extract data from multiple sources including text files, Excel spreadsheets, web resources, databases, cloud, and many other options.
Instrutor :
Frequency:
Days:
Certificate:
Power BI Course Modules
Introduction to Power Bi
- Business Intelligence for everyone
- Insights from Data
- What is Data analysis
- What/Why Power Bi?
- Different Data sources for Power Bi
- Installation and Prerequisites
- Power Bi Users and DEMO
Power Bi Desktop
- Welcome screen
- Importing data
- Visualization plane – Creating column charts
- Pie charts
- Stacked column charts
- Maps – azure maps
- Power bi maps
- ArcGIS maps
- Editing Report interactions
- Tables and matrices
- Cards
- Hide columns from the report view
- Delete unused columns
- Slicers and Filters
Power Query Editor
- Intro to the Power BI Query Editor
- Basic Table Transformations
- Changing data types Text, Number & Date Tools
- Filter the data using Power Query
- Add Columns, Merge Columns, and Modify Columns in Power query editor
- Combine data from various tables into a single table
- V Lookup
Fact vs Dimension Tables
- Intro to Database Normalization
- Data (“Fact”) Tables vs. Lookup (“Dimension”) Tables
- Creating Power BI Table Relationships
- “Star” vs. “Snowflake” Schemas
- Active vs. Inactive Relationships
- Relationship Cardinality
- Connecting Multiple Data Tables
- Power Bi – Creating Custom Features Bookmarks
- Drill Through and Drill Down
- Custom Tooltips
DAX Measures
- Intro to Data Analysis Expressions (DAX)
- Calculated Columns vs. Measures
- DAX Syntax & Operators
- Common Power BI Functions
- Logical & Conditional Statements
- Text, Math & Stats Functions
- Joining Data with RELATED, CALCULATE, ALL & FILTER Functions
- DAX Iterators (SUMX, AVERAGEX)
- Time Intelligence Formulas
- DAX & Power BI Best Practices
Publish Options and Manage Datasets
- Understand the components of the Power BI Service and how they tie together
- Manually Refreshing data in the Power BI Service Data Gateways
- Providing Access to Datasets
- Configure a Dataset Scheduled Refresh
- Configure Incremental Refresh Settings
Optimize Power Bi reports for performance
- Performance Analyzer to analyze visuals latency – choose which type of visuals for better performance
- Use of Star Schema
- Query folding
- Calculated columns vs measures
- Best Practices
Power Bi Preview features and Bookmarks
- Q and A for NLP
- Optimize using synonyms and renaming Import vs Direct query
- Pop-up Messages
- using Bookmarks
- Toggle visuals with buttons using bookmarks
Reports vs Dashboards and Workspaces
- Overview of App workspace
- When to use dashboards and reports
- Using python scripts in Power Bi
- AUTO-ML in Power BI
Related courses

Excel
Learn the Excel skills needed to manage data, create charts, and perform basic to intermediate operations.

Python Programming
Learn Python syntax, data structures, & coding principles to develop applications and automate tasks.

Advanced Excel
Learn complex functions, pivot tables, macros, and data analysis tools for professional Excel proficiency.

Certified AI Professional
Learn AI fundamentals, including machine learning and neural networks, for real-world applications.
Advance your career with our Microsoft Power BI course
Develop your Microsoft power bi skills with the most comprehensive range of Microsoft power bi courses. Join the Microsoft power bi Course Today!


